How to Read Crypto Candlestick Charts: A Beginner's Guide
Candlestick charts pack a lot of information into a small space. This guide explains what the body and wicks of a candle represent, how to tell bullish from bearish candles, and a few common patterns — plus a strong reminder that patterns are hints, not guarantees.
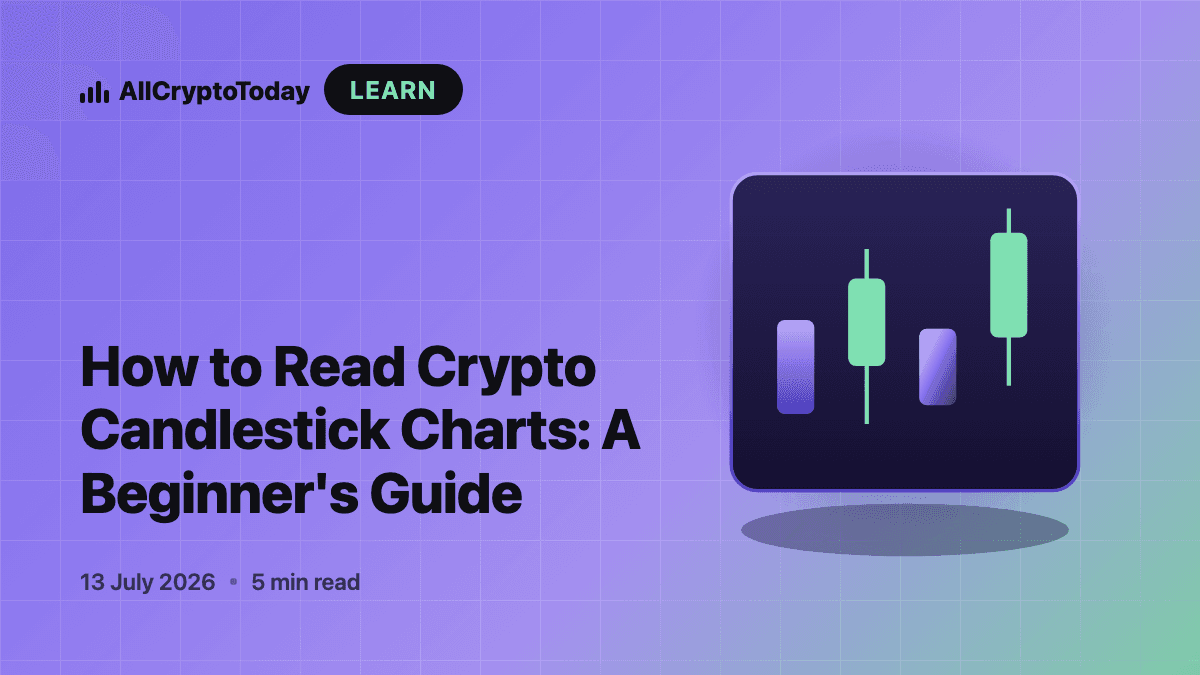
Open any crypto price chart and you will see rows of little red and green bars with lines poking out of them. Those are candlesticks, and once you can read them, price charts become far less intimidating.
What a single candle shows
Each candlestick represents price movement over a fixed period — one hour, one day, and so on. A candle has two parts:
The body
The thick part shows the open and close prices for that period.
- A green (or hollow) candle means the price closed higher than it opened.
- A red (or filled) candle means it closed lower than it opened.
The wicks
The thin lines above and below the body are the wicks (or shadows). They mark the highest and lowest prices reached during the period, even if price did not close there.
A long upper wick means buyers pushed the price up but could not hold it. A long lower wick means sellers pushed it down but buyers fought back.
Reading momentum
Put many candles together and you start to see momentum:
- A run of green candles with small wicks suggests steady buying.
- Candles with long wicks on both sides suggest indecision and volatility.
- A sudden large candle often marks a reaction to news.
A candlestick does not predict the future. It simply summarises the tug-of-war between buyers and sellers in one tidy shape.
A few common patterns
Traders name certain shapes, but treat these as hints, not signals to act on blindly.
Doji
A candle with almost no body — open and close are nearly equal. It signals indecision and can appear before a change in direction.
Hammer
A small body with a long lower wick, often seen after a decline. It suggests sellers lost control by the close.
Engulfing
A large candle whose body fully covers the previous one. A green candle engulfing a red one can hint at a shift toward buyers.
The most important caveat
Patterns are probabilities, not promises. They work best combined with context — volume, the broader trend and news — and they fail often enough that risk management matters more than pattern-spotting.
Key takeaways
- The body shows open and close; the wicks show the high and low.
- Green closes up, red closes down.
- Patterns are hints. Never trade on a shape alone, and never risk more than you can afford to lose.
DISCLAIMER
All the content on this site should not be considered investment advice. Investing is speculative. When investing your capital is at risk.

DeFi & Ethereum Editor
Elena leads our DeFi and Ethereum coverage. A former protocol analyst, she explains yield, governance and smart-contract risk without the jargon.